Version 5 Manual
Voice over IP (VoIP) troubleshooting
Introduction
Using an IP Network (like the internet) to conduct a voice conversation (VoIP) is becoming easier and easier for people to do. It can be inexpensive and relatively reliable.It can, however, also be challenging - with poor voice quality, the inability to hear and communicate, delays and other problems.
The underlying technology for VoIP is extremely network dependent. If you're having voice quality problems, the problem is often related to the network - maybe your internet provider or maybe some other component between you and the called party. This article will talk about some basic troubleshooting techniques that can be used to locate where the problem is occurring so you can make good decisions about how to solve the problem.
Network-related VoIP Symptoms
Many symptoms of VoIP problems are network related (although certainly not all of them). Here are some examples of symptoms that are often network related:
- Garbled words ("blips" and clicks mixed in with the words)
- Parts of words missing
- Gaps where the other side is talking, but you don't hear any of it
- High "distortion"
- Delays between the time you talk and the other side hears you (and vice versa)
- You start talking not realizing that the other party has started talking already too, and you talk over each other for a few seconds
Other symptoms might not be network related. In particular, if the symptom *always* happens, any time of the day, any day of the week, then there's a decent chance it's not a network problem.
- Echo when you talk. This can be exacerbated by network problems, but constant echo is usually not caused by network problems.
- Inability to connect a call to some users while you can call others
Using PingPlotter to identify the source of network problems
PingPlotter has some unique capabilities in its ability to help you track down the source of network problems. What you really want to know is:
- Can you fix the problem or do you need to call someone else to fix it?
- If you need to call someone else, who do you call? Your ISP? Your VoIP provider?
- When you call them, how do you convince them it's their problem to fix?
PingPlotter can offer a lot of insight into all of these questions.
Collecting data with PingPlotter
Before we can do much analysis, we need some data to analyze. We cover some of these topics in earlier manual entries, so we won't cover *details* of how to set things up here.
First, we need a target server to monitor. Ideally, this would be the actual VoIP server of your VoIP provider, or something on the same area of the network. If you called your VoIP provider and they asked you to collect PingPlotter data, they may have given you a server to use. In many cases, the use of any server can work, but this will only identify problems with your ISP - not with your VoIP provider. The good news here, though, is that the vast majority of VoIP problems are because of front-line service providers (like your ISP). If you don't know what address to use and you have no way of finding out what address your VoIP hardware or software is using, try using the web site of your provider.
For this discussion, we will be a fictitious server (Final.Target.1) as the server we're monitoring and using for troubleshooting.
In your instance of PingPlotter, enter your VoIP server (or related target in the "Target name" field, and set the trace interval to 2.5 seconds. Now, hit the "Trace" button (or the "enter" key on your keyboard), and you should see a picture appear that looks something like this:
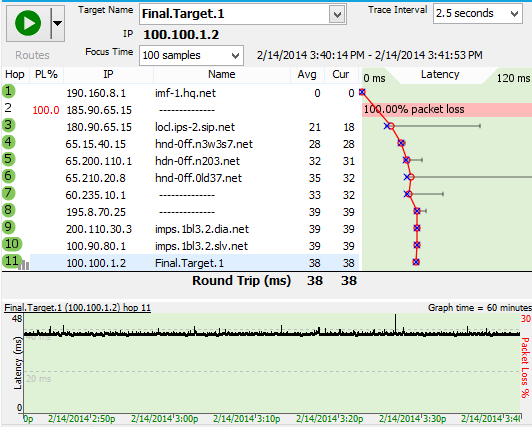
The upper graph should show a full route, including the "Round Trip". If you don't get a Round Trip, check in the troubleshooting section of this document for some ideas.
Now, let this run for at least 30 minutes - preferably, during a period where you're making a voice call. Ideally, you'll have a period where you have a voice call that's good and one that's bad, but that might be possible. If nothing else, just let it run for long enough to get a good sample of your network conditions.
A great thing to do while you're collecting data is to make notes in the PingPlotter data about what you're experiencing. You can see instructions on how to do this in our Timeline Graphing entry under the "Creating Comments" section.
The data we collected covers several days. PingPlotter works great to just run over a long period of time so you get a good idea of what network conditions look like - during good times and bad.
Examining data with PingPlotter
Once you've collected some data, it's time to have a look at what might be the problem. We cover some of the PingPlotter commands on zooming, focusing and digging in the Finding the source of the problem section.
One of the key things to know here is that we're looking for problems at the last hop only - and then using the other hops to determine where the problem starts. Packet loss or latency that shows up only at an intermediate hop is not a problem!
Let's look at the graph above. Notice how hop 2 has a full 100% packet loss? The final destination looks rock-solid, though - no packet loss and the latency, and it is mostly nice and smooth. This is, in general, what you want to see - a mostly flat line at the final destination, no packet loss (red lines in the time graph).
So, what are we looking for, when it comes to problems?
The first place to look is the final destination. If the time graph looks like the graph above (straight line, no red), then PingPlotter is not finding network problems. Look for problems at the final destination. If you find a problem at the final destination, then look back until you find the first hop showing similar symptoms - that's who we probably need to contact to get the problem corrected.
Example: Distributed packet loss
Let's look at an example, this time an example with problems:
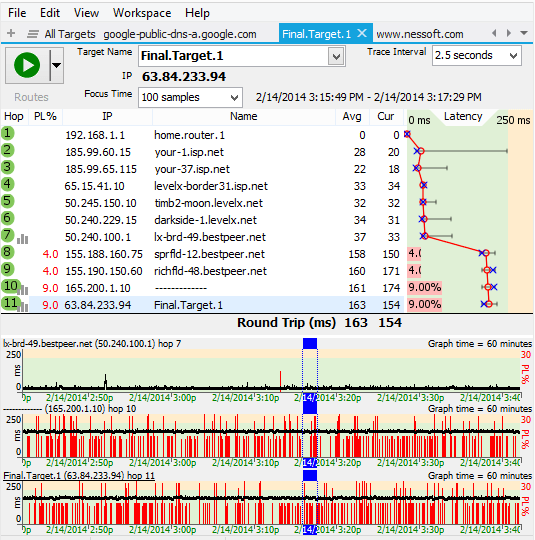
Here, we see 9% packet loss at hop 11 (the final destination). This would result in poor voice quality, dropped "bits" from words and hard to understand conversation. Notice that the latency is pretty good still - it's just the packet loss that's a problem (packet loss is all of the red in the time graphs and the red bars in the trace graph). With a pattern like this, voice quality would be consistently "iffy" - not unusable all the time, but not very good either.
Notice how the packet loss is happening at all hops from hop 8 onward, while hop 7 looks relatively good. The packet loss percentage fairly similar all the way down (although, statistically, it would be just about impossible for all hops to have identical packet loss percentages with this kind of loss). To turn on and off time graphs like this, just double-click on the hop number in the trace graph.
So, in this situation, the problem looks to be between hop 7 and 8. It's pretty likely that Bestpeer knows about this problem - it's in the "middle" of their network - and it's all owned by Bestpeer (we can see that from the DNS Name column).
In this case, we would need to contact Bestpeer about this problem. The picture above is pretty compelling and would be a good communication tool to them.
Example: Local bandwidth saturation
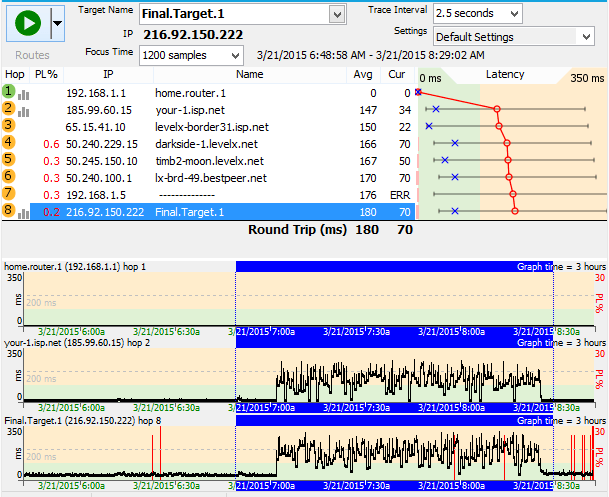
Here, notice the big latency jumps - you have a nice flat line, then a jump in latency, including some packet loss. This pattern is one that is almost always a bandwidth saturation issue (which is the same as congestion). In the case we have here, hop 1 is inside our network (our DSL modem, actually) and hop 2 is inside of our ISP.
This is a case where we were transferring too much during this period - and we were using all of our available bandwidth. A VoIP call would suffer significantly during these periods - there is a lot of jitter (the "ragged" line is an easy way to see jitter - where packets take different amounts of time to arrive), higher latency and some packet loss. The voice quality would be bad, there would be additional lag, and it would probably have audio drops.
There are a few options for solving this one, but none of them involve complaining to anyone else:
- You can install a traffic shaping modem that gives higher priority to VoIP data (actually, unless you've configured PingPlotter packets to look like voice data, you might already have one of these in place - this article does not cover that topic, though).
- You can get more bandwidth (although that doesn't solve all problems - as you'll still be able to use all your bandwidth).
- You can use less bandwidth.
- You can get an additional broadband connection and dedicate it just to VoIP (this is an especially good idea for heavy VoIP users or businesses). The low cost of an additional broadband connection makes this viable in a lot of situations.
Example: Border congestion
Congestion often happens at network borders - where one network hands off to another. This is relatively common for small, growing ISPs - where they just do not subscribe to enough bandwidth to handle everything. Let's have a look at what this condition might look like.
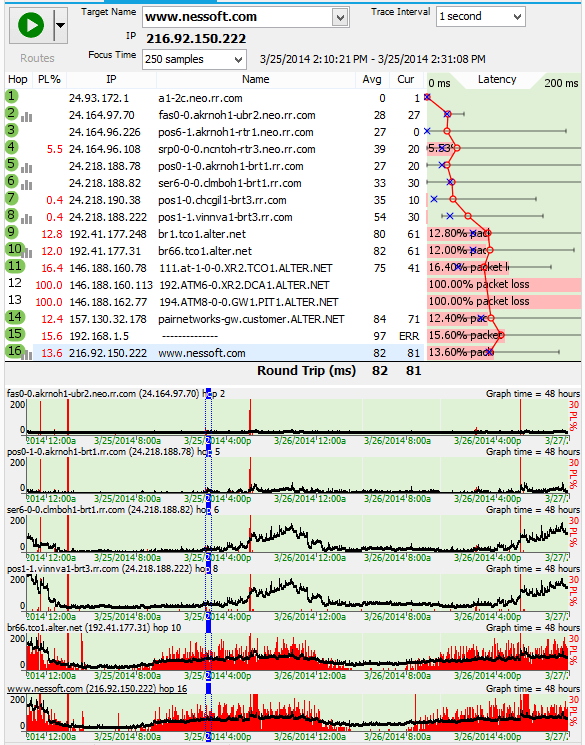
This one isn't *quite* as simple, as there are a few factors. The symptoms of conditions like this would be:
- During high load times, this connection would be completely unusable for VoIP. With 14% packet loss and really high jitter, this would be absolutely horrible for any kind of voice call.
- During the early mornings and late evening, it would be *bearable*, but the jitter would cause the words to be garbled sometimes, and not too fun.
If we look at the network conditions with PingPlotter, we see a couple of problems. First off, there's some serious packet loss starting at hop 4. This packet loss is carried down through the rest of the route to the final destination. This is a border - between our ISP and levelx.net. Having problems at borders like this is pretty common - that's where one company pays another to handle traffic. If a company is growing, it might be "oversubscribed" - using more bandwidth than is available.
An interesting part of this is how during heavy load times for home users (ie: evening hours), the packet loss and latency are worse. During early morning hours, it goes back to being OK again. This is a big sign that the problem is load related - and that this link is having congestion problems at "rush hours". Time to add some lanes!
Another problem, though, is inside the rr.com network there is significant latency and jitter. There are some slight symptoms at hop 2 (which is the border between our internal network and rr.com - so that's the cable modem), but starting at hop 6 there's some real bumps in latency and the jitter (latency variation) is also a big cause for concern.
In this case, both problems are inside the rr.com network, and since we are an rr.com customer, we would call them for help on this.
Example: 802.11b network near its range limit
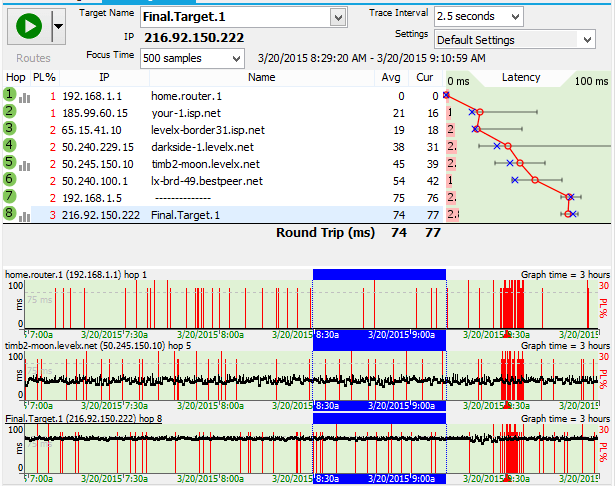
Here's an example where we're connected using a computer-based VoIP service (like Skype). Our computer is hooked up to our DSL modem via a wireless 802.11b network. Hop 1 is our DSL modem.
Here, we see a little bit of packet loss being added to every hop - our wireless network is losing a few packets (about 1 to 2 percent, it looks like), and this impacts everything this computer does - including our VoIP connection.
The call quality would be generally good here (probably better than acceptable - up to the "good" range, really). The latency is fine and there is very little jitter, but there is a little packet loss. There is a problem, though - at 9:31am, our call was interrupted - it looks like hop 1 lost a bunch of packets all together and during that period, we were unable to hear anything. Let's zoom in on that a bit.
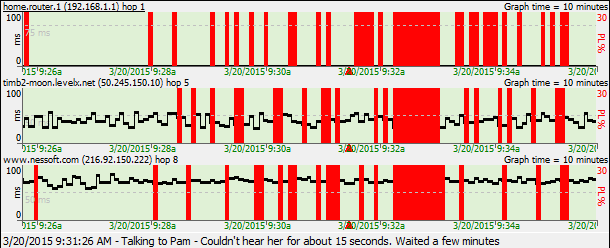
See the period where we start getting a lot more packet loss, and then all the hops show a big block of lost packets - a period where it's likely no packets were getting through.
Here, the solution might be to move the wireless access point, or switch to wired on that computer.
Reporting problems, when you find them
If you're using PingPlotter, it's almost certainly because you're experiencing some kind of problem - and when you find something that you think might be the cause of that problem, you need to communicate that to the right party.
We cover this topic in some depth in our Getting Started Guide. The piece we want to stress here is that the data in PingPlotter doesn't really mean anything unless you correlate it with a network problem (like poor VoIP quality). It's of paramount importance that your complaints include a description of how this problem is affecting you. Don't just send a graph from PingPlotter expecting them to be able to figure out what was wrong.
One great way of doing this is to put comments in the PingPlotter graph itself using the "Create Comment" feature of the time graphs. Make comments every time your VoIP quality is bad. Make comments when you give up on a conversation because they can't hear you at all (but you can hear them just fine - how frustrating!).
Troubleshooting PingPlotter
If you get "Destination Unreachable" at something beyond hop 3 or so, but can access that site via a web browser.
Some sites do not respond to ICMP echo requests. See our knowledge base article for instructions on how to configure PingPlotter to use TCP packets instead of ICMP.
If you get "Destination Unreachable" at hop 1 for all targets
Make sure your software firewall (ie: ZoneAlarm, etc) is configured to allow PingPlotter to have access to the network.
If you only have the final hop visible - and all intermediate hops are empty
We cover this in this knowledgebase article.
Other questions
Jitter
Jitter is the amount of variation in latency. If one packet takes 100ms and the next one takes 200ms, there's 100ms of jitter there. PingPlotter Pro offers jitter calculations and graphs, but PingPlotter Standard (and the 2.x line) still gives you an easy way to see the jitter by looking at the smoothness of the time graph, zoomed in a little. Here's an example:

This is zoomed in enough for us to see the individual samples, and we can see that none of them come in with the same latency. Adjacent samples here often have latency variations of 100ms, and just about every one has latency variation of 30ms or higher. Just looking at this graph, we can see a lot of jitter. Compare that to the first picture in this article - where the line was completely flat. We're looking for the flat lines, not big variations with red stuck in everywhere.
Other resources
This article introduces some concepts and ideas about VoIP troubleshooting. There are other resources online that provide more depth (albeit not within the context of PingPlotter).
www.whichvoip.com/voip-troubleshooting.htm - a great page with real-world solutions and suggestions. Targeted to residential, but useful everywhere.
www.voiptroubleshooter.com is a great site that has an enormous amount of content on which symptoms relate to what kinds of network problems. This site has a relationship with Telchemy, a leading VoIP provider of call quality monitoring tools.