Version 5 Manual
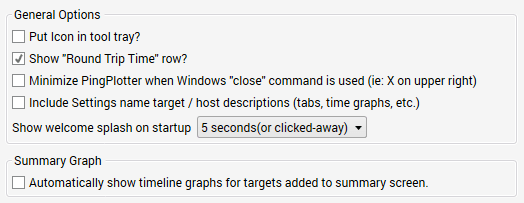
General Options

Put icon in tool tray?
PingPlotter can be minimized to the "tool tray", the small icon "tray" where the clock normally sits, and where a number of other notification icons might appear.
Enabling this option will turn on a tray icon at all times. When PingPlotter is minimized, it will only be visible in the tray. When it’s not minimized, it will show on the taskbar and the tool tray. Alert conditions can be surfaced through the tool tray as well, in which case the icon will change to red and a message might appear.
Show "Round Trip Time" row?
The "Round Trip" row of PingPlotter duplicates the information from the final hop and makes it evident that the host is reachable and what the round trip time and latency is. Before adding this option, we got a lot of questions "What’s the round trip time?"
Minimize PingPlotter when Windows "close" command is used
Turn on this option to cause PingPlotter to minimize instead of close when the "X" button is hit.
If you normally run PingPlotter all the time, you might not want it to close if you accidentally hit the "close" button on the application (ie: the ![]() button). Turning on this option will make PingPlotter minimize instead of close. To close PingPotter, use the "File" -> "Exit" menu option, or if PingPlotter is minimized to the tray, use the right-click "Close" command. Note: using the close command from the taskbar will *not* close PingPlotter, as that is equivalent to using the X button.
button). Turning on this option will make PingPlotter minimize instead of close. To close PingPotter, use the "File" -> "Exit" menu option, or if PingPlotter is minimized to the tray, use the right-click "Close" command. Note: using the close command from the taskbar will *not* close PingPlotter, as that is equivalent to using the X button.
Include settings name in target / host descriptions
In PingPlotter Pro, when tracing to the same target with different engine settings (see our named configurations documentation for more details), the only way to distinguish between the settings is by the named configuration. If you're only using one named configuration (or if you're tracing to all different targets), then this is not so helpful. Turn on this option to show the named configuration on all tabs and time graphs. For the summary graph, turn on the "Settings" column to show the named configuration used for that target.
Show Welcome Splash on Startup
This option allows you to adjust the amount of time the splash screen is shown on start up of the program (there's also an option in the drop-down to not show the splash screen at all).
Summary graphs are exclusive to PingPlotter Pro.
Automatically show timeline graphs for targets added to summary screen
When enabled, anytime a new target is added to a summary, it's respective timeline graph will be automatically opened.
If you regularly trace to a lot of targets (and have them auto-show on the summary screen), turn this option off to control visibility manually.
When a new target or router is added to the summary screen, having a time graph automatically show up can be handy. The downside of this is that a long list of targets quickly fills up the screen and becomes less useful. Turn off this option if you find yourself regularly turning off a lot of the automatically added graphs. You can turn them back on at any time manually anyway.
Timeline graph minimum height
This setting controls how small timeline graphs can become before the size of timeline graphs becomes fixed and a scrolling container is implemented.
**Some of the features listed in this topic are only available in PingPlotter Pro and/or PingPlotter Standard. See our product comparison page for more details**