Using PingPlotter
The Reviews are In: Mean Opinion Score is More Than Just a Rating
MOS is great for seeing your connection quality at a glance, but the numbers are only half the story.
Two thumbs up. Four stars. 80 percent fresh. Doesn’t matter if it’s a movie, a burrito, or your nephew’s piano recital — if it’s worth anything, it’s worth rating. The same goes for your network connection. Knowing how your connection stacks up at a glance can clue you in on potential issues. But how do you assess whether your connection kicks butt or sucks lemons?
Enter Mean Opinion Score
MOS is a simple one-to-five rating of your connection quality. A score of four or higher typically means your network is rock solid, while anything lower indicates a crappy connection. It’s as straightforward as it sounds, but the values themselves are just one tiny piece of MOS’ great legacy. The story of the Mean Opinion Score is the story of telecommunication itself. Its inception, evolution, and calculation are at the root of how we rate just about every comm channel in existence.
Developing the Perfect Score
Although you may know MOS as a VoIP or data network metric, its origin and methodology date back over 150 years to the birth of telecommunication. In 1865, 20 countries came together to standardize telegraph networks worldwide, creating the International Telegraph Union. Over the next century, ITU would morph and evolve as technology advanced and the need for standardization and regulation increased. The modern ITU (which changed “telegraph” to “telecommunication,” for pretty obvious reasons) is now an official arm of the United Nations and oversees everything from radio broadcast spectrums to satellite orbits.
It was ITU that developed the Mean Opinion Score as a way to evaluate the quality of telephonic transmission systems. Test subjects would be isolated and read phrases over a specified line. Subjects would then rate the quality of the sound on a scale from one to five. Take the mean of the ratings and presto! MOS is, quite literally, the arithmetic mean of scored opinions. ITU’s process eventually became the de-facto method of evaluating connection quality. If you’ve ever been prompted at the end of a Skype call to rate your experience, you’ve participated in MOS sampling. In the case of ITU, MOS for audio and video communication is evaluated using specific criteria that continue to be refined to this day. However, you could create an MOS rating for just about anything people have an opinion on.
Finding a Better Opinion
When it comes to PingPlotter, we calculate MOS a bit differently. Instead of trapping people in a box and asking them to evaluate the trillions of network paths on Earth (which did NOT turn out great the first time we tried), we created a formula to estimate MOS values for any network you trace. The formula itself can be found here, but to summarize, we use three variables when approximating MOS:
- Latency: The longer it takes packets to travel between you and your target, the lower the quality of your network connection. We take an average of latency sample values for our formula.
- Percent Packet Loss: Data lost in transmission greatly impacts connection quality. The higher the percentage of loss, the lower the MOS value
- Jitter: Inconsistent network latency can negatively impact experience. Jitter is calculated by taking the differences between latency samples, then finding their average.
Using these factors, PingPlotter generates an MOS value consistent with what you’d produce by having dozens of individual test subjects rate the quality of your connection. In addition, because we capture data for every hop between you and your target, we can calculate an MOS rating for every intermediate hop in a route. This lets you identify where your connection is deteriorating at a simple glance. The simplicity of Mean Opinion Scores is matched by its comprehensiveness. Latency is the most common metric discussed when judging connection quality, but it doesn’t tell the whole story. A low-latency connection with severe packet loss is going to impact experience just as much as a connection with high ping. By combining these three variables, MOS serve as a complete picture of how well your network is functioning.

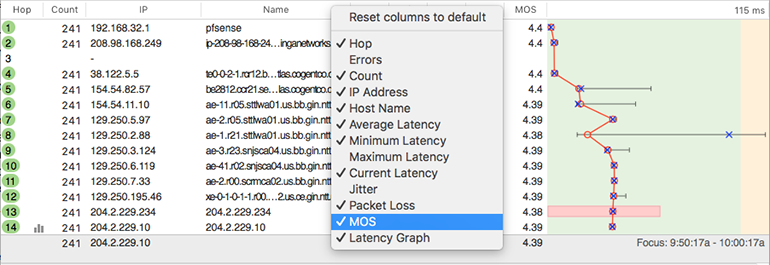
Tracking MOS in PingPlotter is easy to set up. Right-click on the column headers, and select “MOS” from the menu. The MOS column will now appear alongside your other route data.
It is important to remember PingPlotter is using objective data to synthesize a subjective metric. Our MOS formula is very good at generating accurate values, but you may find making small tweaks to the calculations helpful for tailoring scores to your specific network or needs. In PingPlotter, you can edit the MOS script by following these steps:
- Navigate to the MOSColumn folder which is, by default, located:
- For Windows: C:\Program Files (x86)\PingPlotter 5\Extensions\MOSColumn\
- For Mac: Right click the App > Show Package Contents > Contents > Resources > Extensions > MOSColumn
- Open moscolumn.js in your favorite text editor
- Go bananas!
There are tons of ways to dissect the quality of your connection. Sometimes, though, all you want to know is if it’s good enough. Mean Opinion Scores tell you in a flash where you stand. MOS in PingPlotter can help you identify route bottlenecks or provide a general overview of your network without ever needing to lock someone in a room.
Do you support other people?When remote workers have connection trouble PingPlotter Cloud helps you help them.
