PingPlotter Cloud Manual
Target View

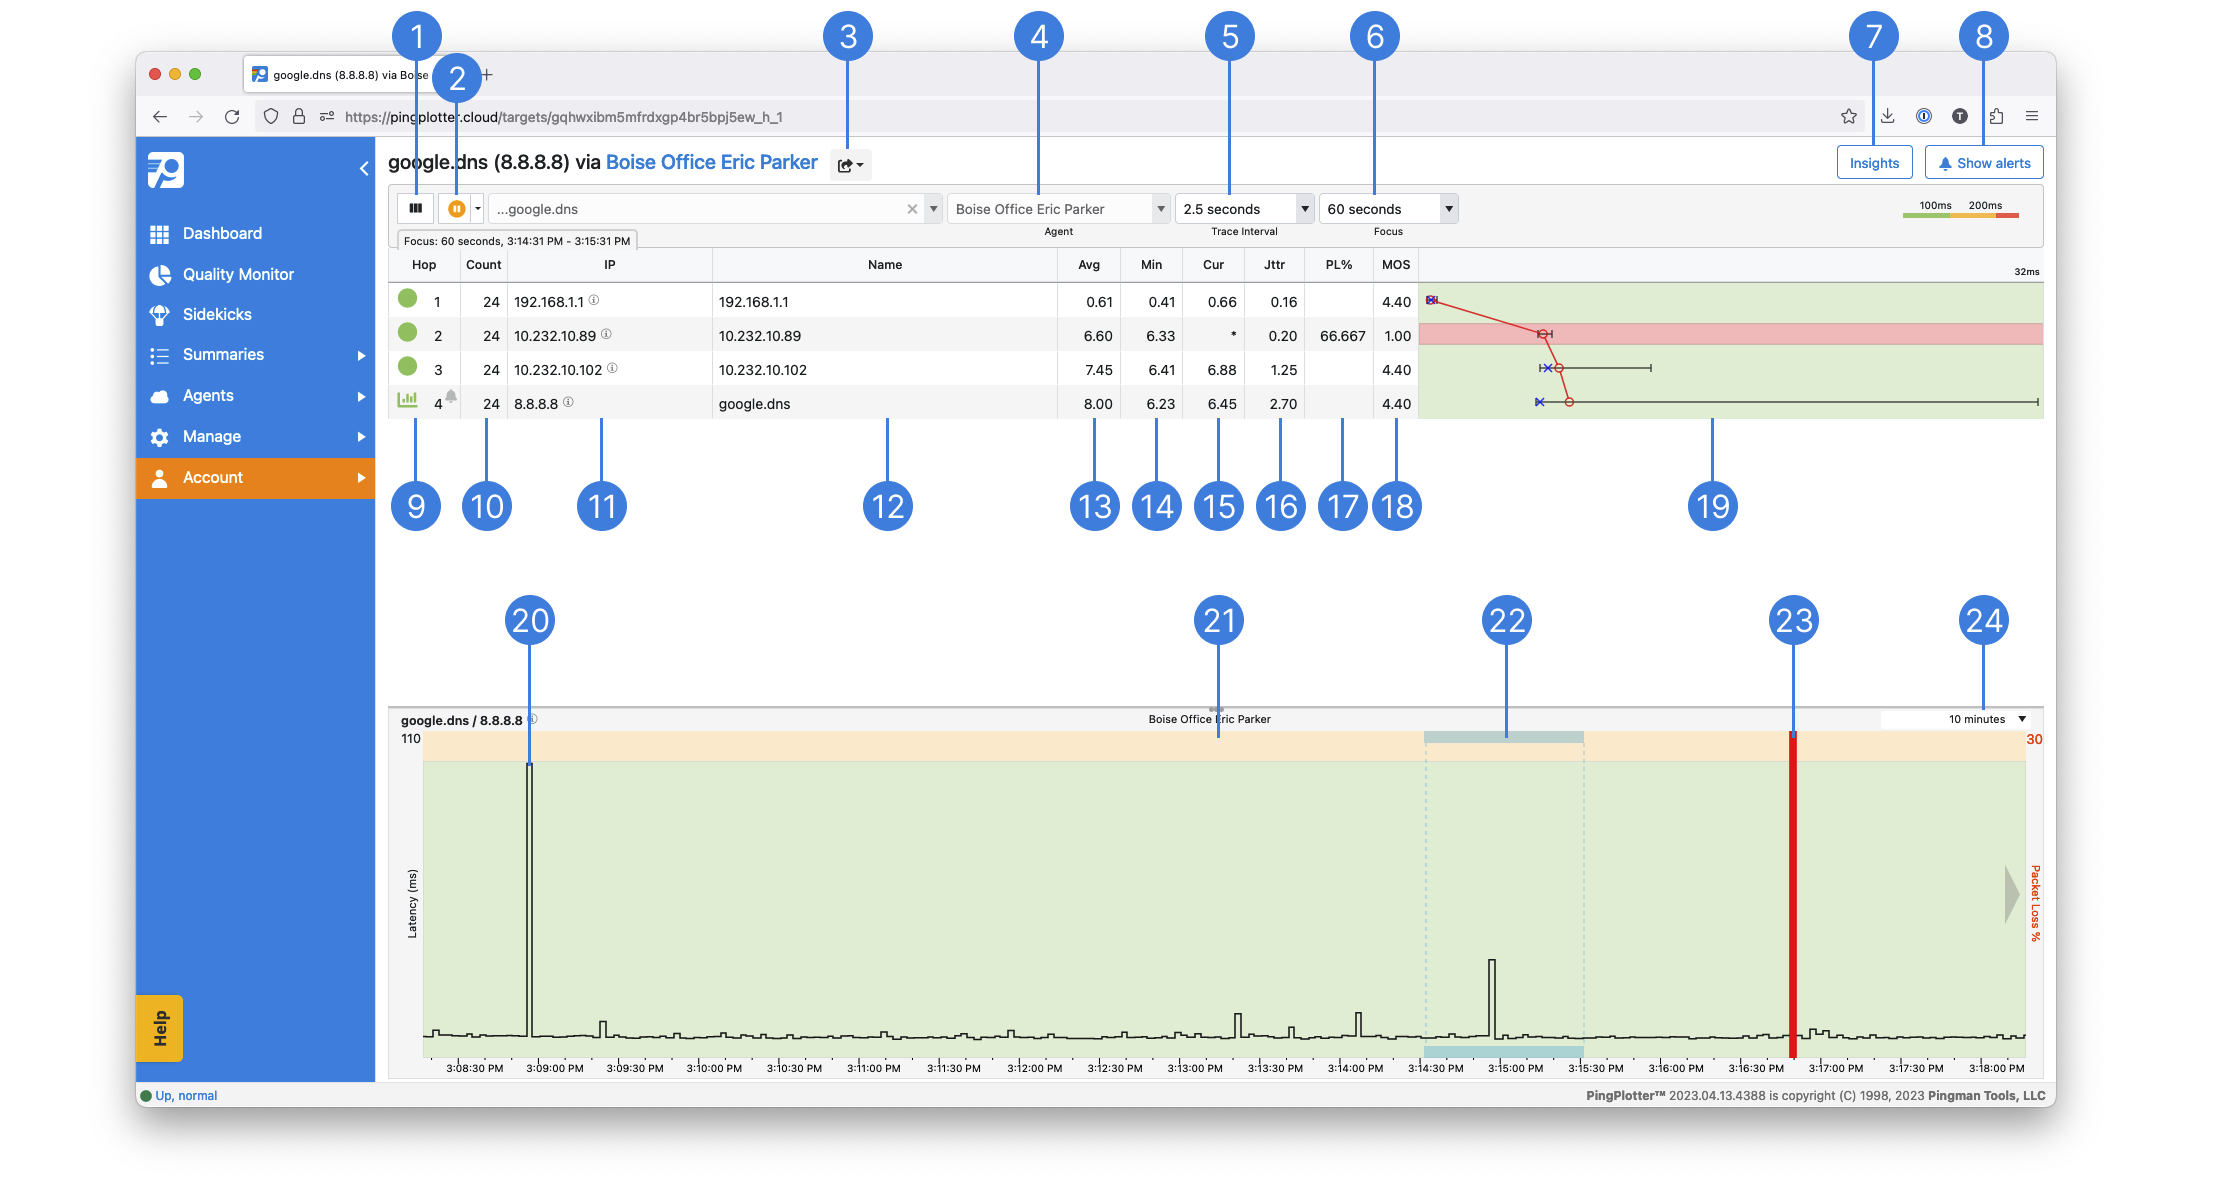
Change Columns
Add or remove columns of data to make the interface your own.Target Controls
Resume, Pause, or Stop the current trace.Share Options
Create a LiveShare - a read-only weblink to the current summary, take a Snapshot image, download summary statistics, export statistics over a time range, download a PP2 File.Agent
The Agent currently running the trace.Trace Interval
How frequently the Agent sends a new packet.Focus
The window of time for which the Trace Stats are shown. When set to Auto, it reflects the stats for the visible time range on the Timeline Graph.Insights
Analyze the last 24 hours of data and automatically identify the culprit.Alerts
Opens the Alert Panel where you can send notifications, integrate with other products, and take other actions when the trace meets certain conditions.Hop
This lists the order of hops between you and your target. A circle denotes an active hop and is color-coded to show latency based on the Graph Color Legend. A graph icon shows which hops have a Timeline Graph open (more on that later).Count
The number of packet sent during the selected Focus period.Name
The DNS name of the give device, if available.Avg
The average ping response time for the current focus period. This average ignores timeouts and lost packets.Min
The fastest ping response time for the current focus period.Max
The longest ping response time for the current focus period. This value ignores timeouts and lost packets.Cur
The response time for the last packet sent. If you see “ERR,” the last packet sent was lost.Jttr
The current network jitter average for the current focus period.PL%
The percent of lost packets over the current focus period.MOS
A synthesized Mean Opinion Score based on the current network conditions.Latency Graph
O is the average latency, X is the current latency, |-| denotes the minimum and maximum latenciesLatency
The black line shows the lateny for that specific time. Hover over a spot to get more details.Timeline Graph
a visual representation of your collected trace data. It helps you see the fluctuations in network performance over time. Click and drag to scroll back and forward in time.Focus Period
The section of collected data currently being displayed in the Trace Graph.Lost Packet
An indicator showing a packet sent in the trace session that timed out.Time Range
Change the amount of time shown on the Timeline Graph.
Starting a trace
- Select the summary to which you wish to add a trace. By default, you will have the All Targets summary to start with
- Choose an Agent you wish to start the trace from in the Agent dropdown menu
- Type the IP address, URL, or DNS name of the server you wish to trace to
- Hit Enter or click the green Start button to begin the trace
Clicking on the blue IP address of the new trace will open it in the Trace View, showing each hop in the route between the Agent and the target.
Note
The Trace View has menu options available using a right-click, with the exception of the IP cells.