PingPlotter Cloud Manual
Summary View

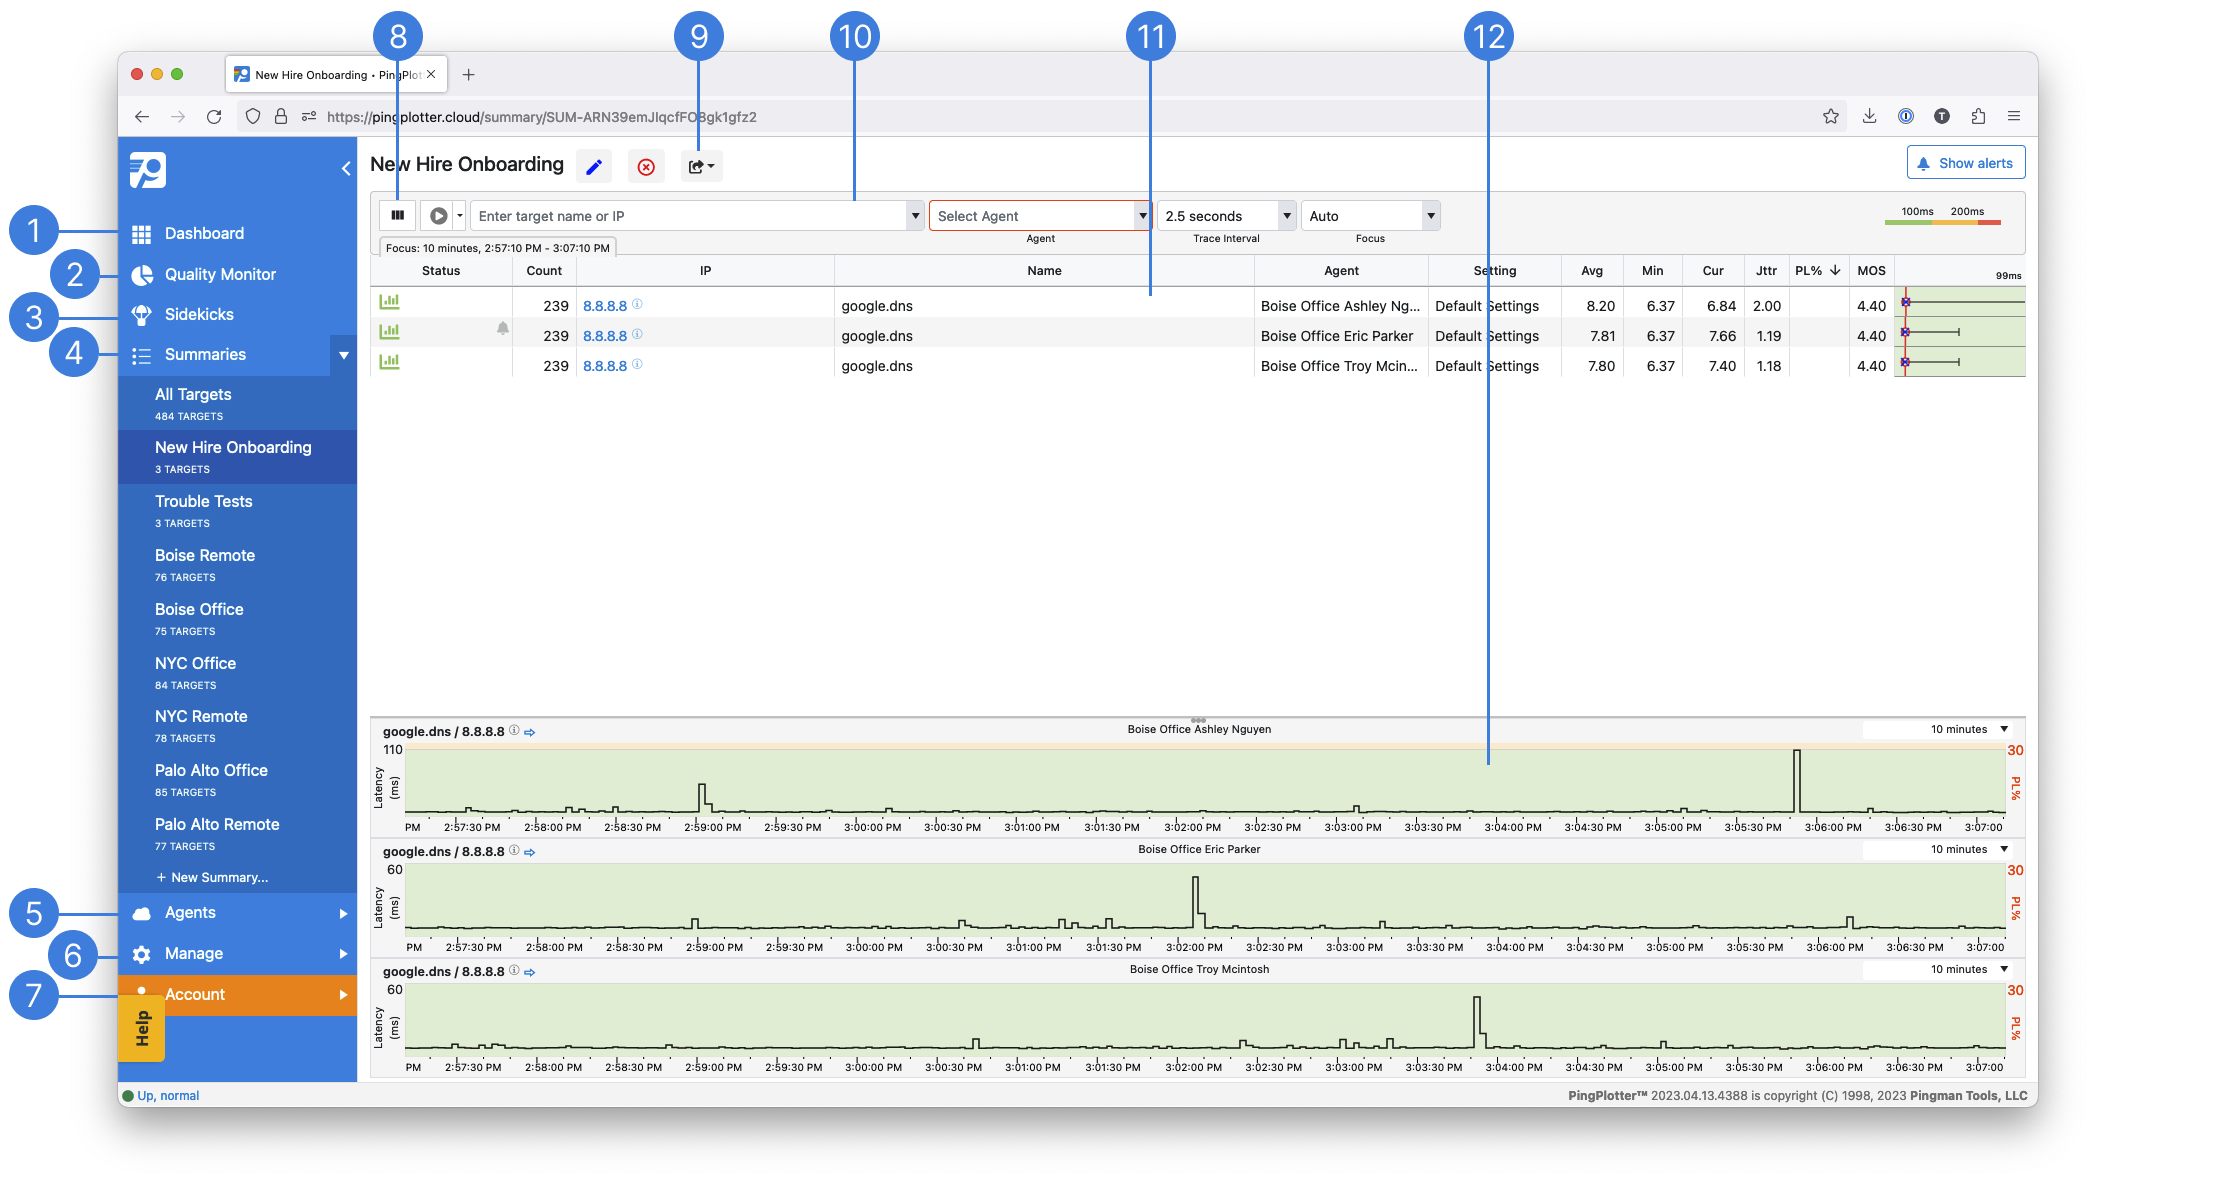
Dashboard
Your home for all things PingPlotter Cloud.Quality Monitor
See all of your connections in one place. Quickly who identify who is having Internet connection issues.Sidekicks
Automatically test the critical components of a network.Summaries
This is a list of all your current summaries. To create a new Summary, open the dropdown and select + New Summary...Agents
Create, deploy and manage PingPlotter Cloud Agents.Manage
Make changes to your Subscription, add/remove Users, add/remove LiveShare links, add/remove Sessions, change account Settings.Account
Update your password and enable 2FA.Change columns
Add or remove columns of data to make the interface your ownLiveShare
Create a read-only weblink to the current summaryTarget Bar
Start, pause, stop, and configure a PingPlotter Cloud trace to a specific IP address or DNS nameName column
The field where the DNS name or custom name is populatedTimeline Graph
A graph of network performance over time. Double-click the green, yellow, red or black Status Light on the left side of any target row to add a Timegraph to the bottom of the screen
Note
If your administrator has created a PingPlotter Cloud user account on your behalf, you may not see every menu option depending on your user profile permissions. If you cannot access a specific menu option or element, contact your administrator and request access.
Summaries are a way of grouping trace sessions together to better organize your workspace. For instance, you could create a summary for trace sessions coming out of the LA office and another for the Seattle office.
Your All Targets summary contains all of your active or paused trace sessions - think of it as your "master summary". It lists every target across every summary you have in PingPlotter Cloud.
- To create a new summary, select the Summaries tab in the sidebar and choose + New Summary...
- Start a trace session by choosing your Agent from the dropdown list, then enter your target IP, URL, or DNS name
- To show a target on another summary, use the dropdown arrow in the trace row's Status cell and select Show on Summary → [summary name]
Note
The Summary View has menu options available using a right-click, with the exception of the IP cells.