Interpreting PingPlotter Results
You've captured something in PingPlotter that looks like evidence of a network problem. Let's take a closer look and see what the graph tells us about the source of your network problem.
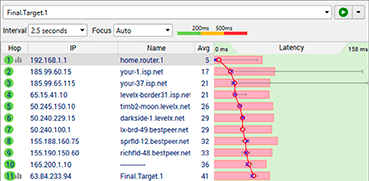
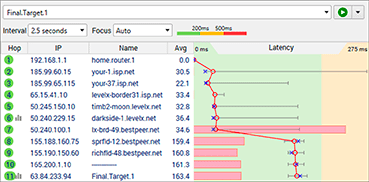
Understanding PingPlotter graphs begins with the final destination — that's the target you're testing. PingPlotter represents the final destination with the bottom row of the trace graph.

The final destination is the bottom row of the trace graph
Check for packet loss
Take a look at your PingPlotter results. Do you see a red bar? If so, that means some data was lost between your computer and the target. This effect is known as packet loss, and if you're seeing it on the final destination, there's a good chance you captured a problem.
Check for latency
What about the black line? It shows how long it takes data to travel to your target and back. This measurement is known as latency. It's another network problem indicator. The further to the right the black line is the longer it takes for data travel around the network. If you see high latency on your final destination, you've probably captured a network problem.
Follow the pattern to the source
When you have an idea of what's happening on the final destination, it's time to look at the rows leading up to the final destination. Do you notice any patterns leading up to the final destination?
Where the pattern begins, helps you understand the source of the problem. If the pattern starts on the first row in the graph (your router), you're probably dealing with a local network problem.
If the pattern originates somewhere in between the first and last row, the problem is probably outside your local network.
Need some help?
PingPlotter results are often discussed in online communities. You can always share your results with others (or use PingPlotter Sidekick to get automated assistance!).
It's time to make a diagnosis. Do you think the source of your problem is on your local network, or it is it outside your local network? Click the button that corresponds with your problem, and we'll start looking at solutions. If you aren't sure about your diagnosis, check out our instructions on how to get help with your PingPlotter results.
Let PingPlotter help you troubleshoot.
PingPlotter Sidekick automates setup and guides you through troubleshooting.

