Getting Started Guide
Step 3: Record the Results
So, PingPlotter’s been running like a champ and collecting all sorts of data. Now it’s time to start parsing it to find the problem.
First, you need to know what you’re looking for.
Seeing the Signs
After you’ve collected a large sample set of test data (we recommend at least an hour to start), it’s time to begin the hunt for evidence of the issue. The Trace Graph will tell you a lot about where and how the issue has manifested.
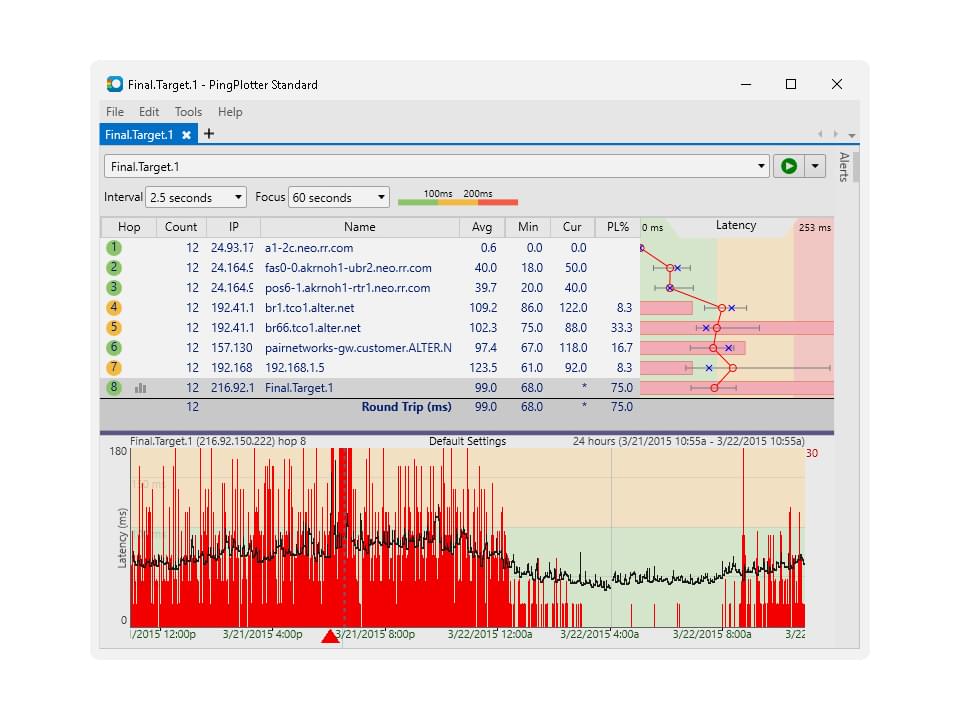
Imagine PingPlotter looks something like this:

That’s a lot of red! Looks like a bunch of packet loss is hitting you where it hurts.
In most cases, your main focus should be the status of the final hop (the target). Think of it this way: If packets are arriving at their destination quickly and safely, does it matter what happens to them along the way? The problems impacting the target are the problems impacting you, and finding where they begin is the ultimate goal.
As you can see from the screenshot, if you follow the problem backwards from the target, it appears the packet loss starts about halfway through the route. This middle hop is most likely the cause of any issues.
The Timeline Graph can show where to focus your attention. By looking through the graph for the final hop (which is already open by default), you can find times where latency or packet loss is high. By double-clicking on that area of the graph, you can set a focus period and isolate PingPlotter’s results to what you’re interested in most — where the bad happens.
Good to know!
The best ways to know if you’re focused on the right section of data is to run PingPlotter alongside the program or service you’re trying to troubleshoot. If things go south, you can quickly jump to PingPlotter and isolate the incident.
Capturing the Problem
Once you think you’ve found evidence of the issue, you’ll want to capture it. This way, you’ll have info to share with your service provider, a helpful friend, or yourself (depending on the problem at hand).
PingPlotter has several ways to save and share the data you collect. The easiest is to save your session as a PingPlotter sample set file (.pp2). In the file menu, highlight “Export Sample Set” You can choose to export just the data in your focus period or export all the data you’ve collected for the current trace. The sample set file can then be loaded in PingPlotter for you and others to review.
If pictures are more your thing, you can select “Save Image…” from the file menu to save a screenshot of your current target window graph. Once it’s saved, feel free to send it wherever your heart desires.
If text is your jam, you can save your current target window’s trace data in a text-friendly file by selecting “Export to Text File…” in the file menu. After selecting a few options, your text file will be ready for use.
Finally, you have the option to host some of your data on pingplotter.com for easy sharing. From the file menu, highlight “Share.” Hit “Create Share Page,” and PingPlotter will generate a unique webpage just for you. PingPlotter will take a screenshot of your current target window and host a .pp2 file with up to 24 hours of your most recent trace data. You can then hand out the link to your page to make sharing data easier. You can learn more about it here.
Now that you’ve got your data ready for primetime, you can start using it to diagnose the issue…